Edexcel GCSE Maths Foundation Glossary
This Edexcel GCSE Maths Foundation glossary contains key vocabulary you need to learn for your exam paper. You can find all the terms and definitions that you need to understand, from ‘Acceleration’ to ‘Word-based problems’. For more exam and revision help, you can visit our exam support page here. It contains advice from Deb Friis, our trusted expert author at Oxford Revise, to guide you through exactly what to expect.
A (Acceleration to Axes)
acceleration
Acceleration is the rate of change of speed, shown by the gradient in a speed-time graph.
acute angle
An acute angle is an angle between 0° and 90°.
adjacent (trigonometry)
The adjacent is the side next to the angle θ in a right-angled triangle.
algebraic method (simultaneous equations)
The algebraic method is a means of solving simultaneous equations using algebra and not a graph. The methods are the elimination method and the substitution method.
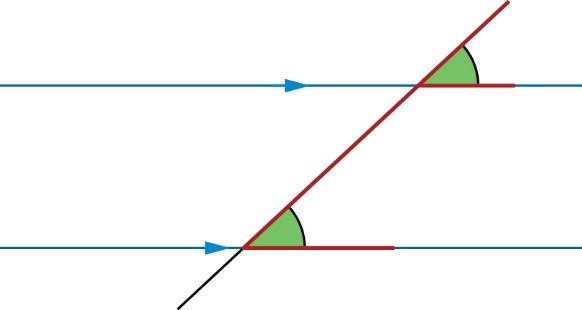
alternate angles
Alternate angles are on the opposite sides of a transversal line that intersects a pair of parallel lines. Alternate angles are always equal.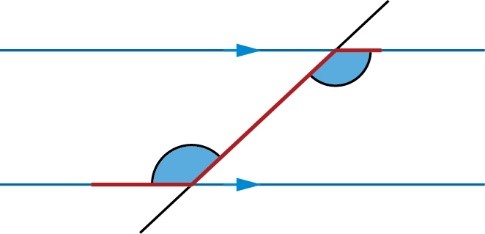
angle
An angle is the amount of turn, usually from one line to another line connected at a point (vertex).
arc
An arc is a part of the circumference of a circle.
area
Area is the flat space inside a 2D shape. Typical units are cm² and m²
arithmetic sequence
An arithmetic sequence (or linear sequence) is one in which the next term can be found by adding or subtracting the same number each time.
axis [axes]
Axes (singular: axis) are lines that cross at 90°, used to locate points in a coordinate system.
B - C (Bar chart to clockwise)
Bar charts are used for qualitative (categorical) data. In a bar chart, the height of each bar shows the frequency.
bearing
A bearing is an angle in degrees measured clockwise from north that gives a direction of travel. Bearings always have three figures, for example, a bearing of 3° is written as 003°
biased (probability)
Biased means unfair. For example, an unfair coin or spinner or dice is said to be biased.
biased sample
A biased sample is a sample that doesn’t represent the population well.
bisector
A bisector cuts a line or angle exactly in half.
calculate
To calculate is to find the numerical answer.
causation
Causation between two sets of data when one variable causes the other.
centre of enlargement
The centre of enlargement is the point about which a shape is enlarged.
chord
A chord is a line segment that joins two points on a circle.
circumference
The circumference is the perimeter of a circle.
clockwise
Clockwise means the direction in which the hands of clock travel. The opposite direction is anticlockwise.
C (Co-interior angles to compound shape)
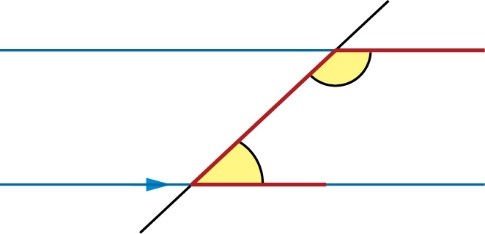
co-interior angles
Co-interior angles are on the same side of a transversal line that intersects a pair of parallel lines. Co-interior angles sum to 180°
coefficient
A coefficient is the number before a letter in an algebraic term. For example: in the term 5xy², the coefficient is 5
column vector
A column vector is a vector whose components are given in a single vertical column.
commutative
Commutative means a calculation can be done in any order. For example,
addition and multiplication are commutative:
7 + 4 = 4 + 7 8 × 2 = 2 × 8
but subtraction and division are not:
7 – 4 ≠ 4 – 7 8 ÷ 2 ≠ 2 ÷ 8
compass
A compass shows the direction of magnetic north, east, south and west.
complement
The complement of a set is the numbers or objects in the universal set that are not in that set. A′ means the complement of set A (numbers or objects not in set A).
composite bar chart
Composite bar charts show two sets of data, stacked in a single bar, on the same bar chart.
composite solid
A composite solid is a 3D shape that is made up of two or more simpler 3D shapes.
compound interest
Compound interest is interest calculated on both the original amount deposited and any previous interest payments made.
compound measure
A compound measure links two measurements. For example, a rate of pay could be £11 per hour and a rate of flow of water could be 3 litres per minute. Speed, density and pressure are also compound measures.
compound shape
A compound shape is two or more 2D shapes joined together to create a single shape.
C (Cone to cubic graph)
cone
A cone is a 3D shape with a circular base and one vertex.
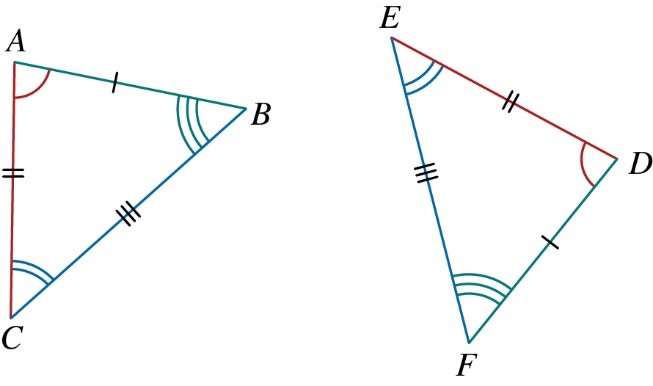
congruent [congruence]
Shapes are congruent if all the sides and angles are equal. To be congruent means to be exactly the same size and shape.
construct
To construct a shape means to draw it accurately with a ruler and pair of compasses.
continuous data
Continuous data is data that can take any value.
Coordinate [coordinates]
Coordinates are an ordered pair (x, y) that locates a point.
coordinate grid
A coordinate grid is a grid and a set of axes that you can plot points (coordinates) and lines on.
correlation
Correlation describes how data may be related. It can be positive or negative, and range from strong to weak.
corresponding angles (in parallel lines)
Corresponding angles are the pair of angles found in the same relative position when a transversal line crosses a pair of parallel lines. Corresponding angles are equal.
corresponding angles (in similar and congruent shapes)
Corresponding angles are the pairs of angles that are found in the same relative position in similar and congruent shapes. Corresponding angles are equal.
corresponding sides (in similar and congruent shapes)
Corresponding sides are sides in the same relative position in similar and congruent shapes. In congruent shapes, corresponding sides are equal.
cube number
A cubed number is multiplied by itself three times, such as 3 × 3 × 3 = 27. The first three cube numbers are: 1, 8, 27
cubed
Cubed means ‘multiplied by itself and then by itself again’. For example, 5³ = 5 × 5 × 5 = 125
cubic graph
A cubic graph has an x³ term in its equation. The general equation of a cubic graph is: y = ax³ + bx² + cx + d where a, b, c and d are constants.
D (Data to dual bar chart)
Data is any information you can collect.
deceleration
Deceleration means slowing down; also called negative acceleration.
decimal
A decimal is a way of representing a number where the number of tenths, hundredths, thousandths, etc. are written as digits following a decimal point. For example: 1.25, 0.66, –9.812
decrease
To decrease means to reduce.
denominator
A denominator is the bottom number in a fraction. For example, the denominator in \(\frac{3}{5}\) is 5
density
Density is a compound measure that is calculated using the formula: density =\(\frac{mass}{volume}\). Typical units include kg/m³ and g/cm³
diameter
The diameter is the distance across a circle through the centre. The diameter is twice the radius.
difference of two squares
The difference of two squares (DOTS) is an expression, such as a² – b², which contains one square number minus another square number. For example, x² – 9 is the difference of two squares.
digit
A digit is any one of the symbols 0, 1, 2, 3, 4, 5, 6, 7, 8, and 9 in the base-ten numbering system.
direct proportion
When two values are in direct proportion, they will increase and decrease at the same rate.
discrete data
Discrete data is data that can only take specific values or numbers. For example, the number of passengers on a bus.
dual bar chart
Dual bar charts show two sets of data, beside each other, on the same bar chart.
E (Edge to equidistant)
edge
An edge is any straight side of a 2D or 3D shape.
elevation
An elevation is the view from the side or the front of an object.
elimination method (simultaneous equations)
The elimination method is a way of solving simultaneous equations where you add or subtract the two equations to get rid (eliminate) one of the variables.
enlargement
Enlargement is a transformation in which the lengths of the object are multiplied by a scale factor, but the angles are unchanged. An object and its enlargement are similar shapes.
equation
An equation is two expressions which are equal in equal in value and connected by an equals sign.
equation of a graph
The equation of a graph is a rule that is true for all points on the graph.
equidistant
Equidistant means ‘the same distance’.
E (Equivalent fractions to extrapolation)
Equivalent fractions have different denominators but the same value as each other. For example: \(\frac{3}{5}\) and \(\frac{6}{10}\)are equivalent fractions.
error interval
Error intervals are inequalities that show possible values of numbers before rounding.
estimate
To estimate is to give or find an approximate answer.
estimation
Estimation is when we use an easier calculation that is roughly the same to give an approximate answer.
expand
Expand means to multiply each term inside a set of brackets by the term outside the brackets.
expected frequency
The expected frequency of an event is the number of times you expect it to happen. Expected frequency = probability × number of trials
expression
An expression is a collection of letters and numbers which cannot be solved (no equal signs). For example,
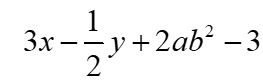
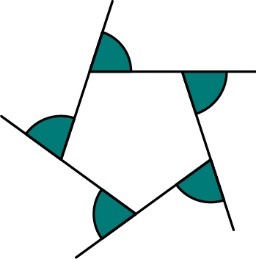
exterior angle
Exterior angles are between a side of the shape and the line extended from the side next to it.
extrapolation
Extrapolation is making predictions outside the range of data.
F (Face to function)
The face is a flat surface of a 3D shape.
factor
A factor is a positive integer that divides exactly into another integer leaving no remainder.
factorise [factorising]
To factorise means to write a number, term or expression as the product of its factors.
Fibonacci sequence
A Fibonacci sequence, named after Italian mathematician Fibonacci, is a sequence where you add the previous two terms to get the next term. The ‘original’ Fibonacci sequence was: 1, 1, 2, 3, 5, 8, 13, 21, …
formula
A formula is an equation which links different variables in a real-life relationship.
fraction
A fraction is a number written in the form \(\frac{a}{b}\), where a and b are whole numbers, and b ≠ 0. A fraction also expresses how a whole is divided into parts. For example \(\frac{3}{4}\) means 3 out of 4 parts.
frequency
Frequency is the total number of times something happened.
frequency tables
Frequency tables are used to collect data and show how frequently each event or quantity occurs.
frequency tree
Frequency trees show the outcomes of two or more events, and the frequencies with which they occur.
function
Function is a rule that describes the relationship between two variables.
G - H (General equation of a straight line to hypotenuse)
The general equation of a straight line is y = mx + c, where m is the gradient of the line, and c is the y-intercept.
geometric sequence
In a geometric sequence, the next term is found by multiplying or dividing by the same number each time.
gradient
The gradient is a measure to describe how steep a line graph is.
graph
A graph is produced by using a coordinate grid to plot values of a function. The graph shows the relationship between the variables in a function.
graphical method (simultaneous equations)
The graphical method is a way of solving simultaneous equations. Using the graphical method, the solution to a pair of simultaneous equations is the point of intersection of their graphs, the point where the two lines cross.
grouped (frequency tables)
Grouped frequency tables are used for continuous quantitative data, such as heights. The data is organised into groups that must not overlap.
highest common factor (HCF)
The highest common factor (HCF) of x and y is the biggest number that is a factor of both x and y.
hypotenuse
The hypotenuse is the longest side of a right-angled triangle.
I (Identity to irregular polygon )
identity
An identity is an equation that is always true, no matter what the value of the variable is.
image
An image is the result after a transformation.
improper fraction
In improper fractions, the numerator is greater than the denominator. For example: \(\frac{18}{5}\)
increase
To increase means to make larger.
integer
An integer is a whole number, such as 1, 73, 946, –17
intercept
The intercept is the point at which a graph crosses either the x- or y-axis.
interior angles
Interior angles are inside a polygon at each vertex
interpolation
Interpolation is using the line of best fit to estimate a value within the range of the data.
intersect
To intersect is to have a common point or points.
intersection (set notation)
The intersection of two sets contains the members that belong to both sets. The intersection of sets A and B is written as A ∩ B.
inverse operation
An inverse operation is an operation that reverses the effect of another operation, such as addition and subtraction.
inverse proportion
Two values are in inverse proportion if, when one increases, the other decreases at the same rate.
irregular polygon
An irregular polygon is a polygon that is not regular – at least one side or angle is different from the others.
L (Like terms to mutually exclusive events)
like terms
Like terms are terms which have the same letters and powers of letters. Order and coefficients do not matter.
line graph
Line graphs (or time-series graphs) show how data change over time. Time is always on the horizontal axis.
line of best fit
The line of best fit is a straight line drawn on a scatter graph which follows the trend of the data.
linear graph
A linear graph is a set of coordinates that make a straight line when plotted. The line can be horizontal, vertical or sloping.
loci
Loci are the sets of points which are all the same distance from a point or a line.
locus of points
The path formed by a point which moves according to a rule or property. For example, the locus of points a fixed distance from a point is a circle.
lowest common multiple (LCM)
The lowest common multiple (LCM) of x and y is the smallest number that is a multiple of both x and y.
mean
The mean is the sum of all values divided by the total number of values.
median
The median is the middle value when the data is put in order. If there are two middle values, the median is the mean of the two middle values.
median class
The median class of grouped data is the class that the middle value lies in.
member
The members of a set are numbers or objects that belong to the set. x ∈ A means x is a member of the set A.
metric
The metric system of measurement uses metric units to measure length, mass, volume, etc. Metric units include metre, centimetre, millimetre, kilometre, gram, kilogram, litre and millilitre.
mixed number
A mixed number includes a whole part and a fraction part. For example: 10\(\frac{2}{3}\)
modal class
The modal class of grouped data is the class with the highest frequency.
mode
The mode is the most commonly occurring value. There can be no mode, one mode or multiple modes.
multiple
A multiple of a is n × a, where n is any other integer.
multiplier
A multiplier is a number, usually a decimal, which is used to calculate a percentage of an amount. For example, to find 82% of an amount, the multiplier is 0.82
mutually exclusive events
Mutually exclusive events are events that can’t happen at the same time. For example, a number cannot be both odd and even.
N (negative number to outliers)
A negative number is any number less than 0
net
A net is a 2D shape that folds up to make a 3D shape.
notation
Notation is a system of symbols and conventions for writing mathematical terms and expressions.
nth term
The nth term is the position-to-term rule for a sequence. You can use it to find any term in the sequence. n is the term number.
number
A number is a value representing a quantity and is used in counting and making calculations.
numerator
A numerator is the top number in a fraction. For example, the numerator \(\frac{3}{5}\) is 3
object
An object is the original shape, prior to a transformation.
obtuse angle
An obtuse angle is an angle between 90° and 180°
opposite (trigonometry)
The opposite is the side across from the angle θ in a right-angled triangle.
orientation
Orientation describes how a shape is positioned on a coordinate grid. For example, when you translate a shape, the object and image have the same orientation (unlike rotations and reflections).
origin
The origin is the point with coordinates (0, 0)
outliers
Outliers are values in a set of data that do not follow the same trend as the rest of the data.
P (Pair of compasses to Pi)
A pair of compasses mark the points at a given distance from a fixed point and are used to construct circles and circular arcs.
pair of simultaneous equations
A pair simultaneous equation are two equations in two variables that you solve at the same time.
parallel (graphs)
Two lines are parallel when they are always the same distance from each other. A pair of parallel lines will have the same gradient.
parallel lines
Parallel lines are the same distance from each other. Parallel lines never meet. They are shown on diagrams by arrows on the lines.
parts (ratio)
A part is a portion or division of a whole.
percent
Percent means ‘out of 100’
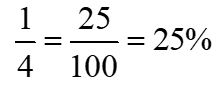
percentage
Percentages are fractions expressed as the number of parts per 100 and recorded using the notation %. For example:
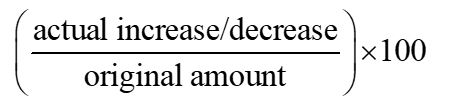
percentage increase/decrease
The percentage increase/decrease is percentage change between an original amount and the amount after an increase or decrease. It can be calculated using the formulae: percentage increase/decrease =
perimeter
The perimeter is the total distance around the outside of a 2D shape.
perpendicular
Perpendicular refers to angles at 90° (right angles) to each other.
perpendicular bisector
A perpendicular bisector cuts a line exactly in half at right angles.
perpendicular distance
The perpendicular distance is the shortest distance from a point to a line.
perpendicular lines
Perpendicular lines are lines at 90° to each other (at right angles).
Pi π
Pi (π) is a number that relates the ratio of the circumference of a circle to the diameter. π = 3.1415, to four decimal places.
P (Pictogram to pressure)
Pictograms are used for qualitative data. They use images to represent the data.
pie chart
In a pie chart, the frequency or amount of something is shown as a sector of a circle.
plan
A plan is a view from directly above an object.
polygon
A polygon is a 2D shape with three or more straight sides, called edges.
population
The population is the entire group of things that you can choose from.
position-to-term rule
The position-to-term rule is a rule that finds the term based on where it is in the sequence. The position to term rule is always written in terms of n and is also called the nth term.
positive number
A positive number is any number greater than 0.
possibility space
A possibility spaces (also called a sample space) is a list of all the possible outcomes of two events. You can write a possibility space as a systematic list or in a two-way table.
power
A power describes how many times a base number is multiplied by itself, indicated by a small, raised number. For example: with \(5^{4} \), the base is 5 and the power is 4 and \(5^{4} \) = 5 × 5 × 5 × 5
pressure
Pressure is a compound measure that is calculated using the formula: pressure = \(\frac{force}{area}\). Typical units include N/m²
P (Primary data to Pythagoras’ theorem)
Primary data is data that you collect yourself.
prime factor
A prime factor is a factor that is also a prime number.
prime factor decomposition
Prime factor decomposition means writing a number as the product of its prime factors. For example, 36 = 2² × 3³
prime number
A prime number is a number with exactly two factors. 1 is not a prime number.
probability
Probability is the likelihood that something will happen. It is always a value between 0 and 1. Probabilities can be written as fractions, decimals or percentages.
probability experiment
A probability experiment is a test where you carry out trials to estimate the probability of an event.
product
The product is the result of multiplication.
protractor
The protractor is a tool used to draw and measure angles.
pyramid
A pyramid is a 3D shape with a polygon base, and triangular sides that meet at one vertex.
Pythagoras’ theorem
Pythagoras’ theorem states that in a right-angled triangle, the square of the length of the hypotenuse is equal to the sum of the squares of the lengths of the other sides. Often written as a² + b² = c².
Q - R (Quadratic expression to ratio)
A quadratic expression is an expression where the highest power of the variable is 2. They are of the form ax² + kbx + c, where a, b and c are the coefficients.
quadratic graph
The quadratic graph is one with equation: y = ax² + by + c, where a, b and c are numbers.
quadratic sequences
In a quadratic sequence, the position-to-term rule includes a squared term.
quadrilateral
A quadrilateral is a 2D polygon with four sides, four angles, and four vertices. Angles in a quadrilateral add up to 360°
qualitative data
Qualitative data is non-numerical data; a quality or characteristic. For example, colour of a person’s hair.
quantitative data
Quantitative data is numerical data, a quantity or amount. For example, the number of students in a class.
quotient
The quotient is the result of division.
radius
The radius is the distance of a point on a circle to the centre.
random sample
In a random sample, each member of the population is equally likely to be chosen.
range
The range of qualitative data is the difference between the largest and smallest values.
ratio
A ratio compares two or more quantities in relation to each other. For example, if a bracelet has 2 red beads for every 3 black beads, then the ratio of red to black is 2 : 3
R (Real-life-graph to ruler)
Real-life graphs are used to represent real-life situations and data.
reciprocal
The reciprocal of a number a is \(\frac{1}{a}\). For example, the reciprocal of 4 is \(\frac{1}{4}\). Any number multiplied by its reciprocal is 1
reciprocal graph
A reciprocal graph is of the form y=\(\frac{a}{x}\), where a is a constant.
recurring decimal
Recurring decimals are numbers with a digit or group of digits that repeat forever. For example:\(\frac{1}{3}\) =0.33333…
reflection
Reflections are a type of transformations where a shape is reflected in a line of reflection (also called a mirror line or line of symmetry).
reflex angle
A reflex angle is an angle between 180° and 360°
regular polygon
A regular polygon is a polygon with equal sides and equal angles.
relative frequency
The relative frequency is the estimated probability of an event, calculated from a probability experiment.
Relative frequency = ![]()
right angle
A right angle measures exactly 90°
roots (used as powers)
Roots are the inverse of powers. For example, ![]() and
and ![]()
roots (used in equations)
The roots of an equation means the solutions to the equation. The roots are also the points where a graph crosses the x-axis.
rounding
When numbers are rounded, they are written only to a given place value.
rotation
A rotation is a type of transformation where a shape is pivoted around a fixed point (the centre of rotation).
ruler
A ruler is used to measure straight lines and distances between points.
S (Sample to similar)
sample
A sample is a smaller set within the population that you can collect data from.
scalar
A scalar is a quantity with just size (no direction). A number is a scalar. Scalars can be used as scale factors or multipliers.
scale
Scale is the ratio that defines the relation between a real-life measurement and a scale model. It is used in maps to represent the real-life lengths in smaller units.
scale factor
Scale factors indicate the ratio of corresponding lengths in two similar shapes. Scale factor = ![]()
scatter graphs
Scatter graphs show the relationship between two sets of quantitative data (or variables). Each point represents one individual from the set of data.
secondary data
Secondary data is data that someone else collected.
sector
A sector is part of the circle formed by two radii and an arc.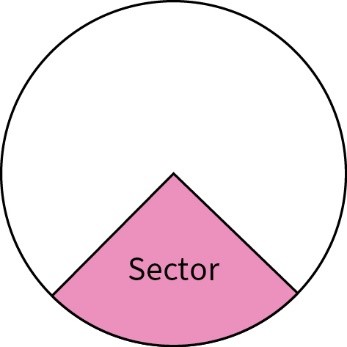
segment
A segment is the region of a circle formed by a chord and the part of the circumference between the two points.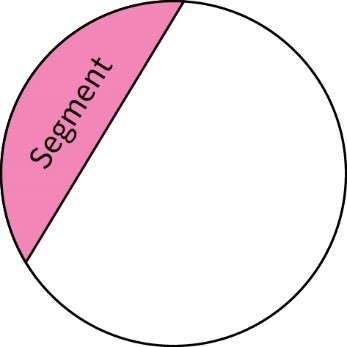
sequence
A sequence is an ordered set of numbers or patterns that follow the same rule.
share
Share means dividing a quantity evenly.
significant figures
Significant figures (s.f.) are digits in a number that contribute to its accuracy.
similar
Similar shapes have exactly the same shape, but different sizes.
S (Simple interest to surface area)
simple interest
Simple interest is calculated only on the original amount deposited.
simplify
Simplify means to write or present an expression in the simplest possible way.
simplify (expression)
Simplify an expression means to write an expression in its lowest terms by collecting like terms.
solve
To solve an equation, you need to find the value of the unknown.
speed
Speed is a compound measure that can be calculated using the formula speed = \(\frac{distance}{time}\). Speed is shown by the gradient on a distance-time graph.
sphere
A sphere is a 3D shape where every point of its surface is the same distance from its centre.
square numbers
A square number is multiplied by itself, such as 3 × 3 = 9. The first five square numbers are: 1, 4, 9, 16, 25
squared
Squared means ‘multiplied by itself’. For example, 5² = 5 × 5 = 25
standard form
Standard form is when a power of 10 is used to rewrite a very large of very small number. Standard form is written in this way: a × \(10^{n} \), where 1 ≤ a < 10 and n is positive or negative integer. For example: 16 000 = 1.6 × \(10^{4} \)and 0.016 = 1.6 × 10⁻²
substitute [substitution]
Substitution is replacing a letter in an expression with a particular number.
Substitution method (simultaneous equations)
The substitution method is a way of solving simultaneous equations where you substitute one variable into another. For example, if one equation has a variable for a subject.
sum
The sum is the result of addition.
surface area
The surface area of a 3D shape is the sum of the area of each face.
T (Table of values to translation)
A table of values is a way of writing down the values that satisfy a function or equation.
tangent
A tangent is a line that touches the circumference of a circle in exactly one point, and is perpendicular to the radius at the point of contact.
term
A term is a single number or variable, or numbers and variables multiplied together. For example: 2, x and 5y are all terms.
term (sequences)
Terms are the numbers in a sequence. First number = first term, second number = second term …
term-to-term rule
The term-to-term is the rule gets you from one term to the next in a sequence.
theoretical probability
A theoretical probability, written as P(event), is the probability that an event will happen.
three-dimensional (3D) shape
A three-dimension (3D) shape is a solid which is not flat.
transformation
A transformation is something that alters a shape’s position and/or its size.
translation
A translation is a type of transformation where a shape is moved to a different position. Translations are often given as column vectors.
T (Transversal lines to two-way table)
Transversal lines are lines that cross two or more lines. Often parallel lines.
tree diagram
A tree diagrams helps you to calculate the probabilities of two or more events. The probability of each outcome is written (or calculated) on each branch.
triangle
A triangle is a 2D polygon with three sides, three angles, and three vertices. Angles in a triangle add up to 180°
triangular numbers
Triangular numbers form a triangular dot pattern. The first four triangular numbers are: 1, 3, 6, 10
trigonometry
Trigonometry is the branch of mathematics that studies the relationships between the sides and angles of triangles.
truncate
Truncate means removing digits without rounding. 3.7546 truncated to 1 decimal place is 3.7
turning point
The turning point represents a maximum or minimum point on a graph.
two-dimensional (2D) shape
A two-dimension (2D) shape is any flat shape or picture.
two-way table
A two-way table organises data into two categories.
U - W (Ungrouped to word-based problem)
Ungrouped frequency tables show the frequency of each data value. They are suitable for discrete data, such as the number of days it rained in one week for a period of 11 weeks.
union (set notation)
The union of two or more sets contains the members that belong to either set. A ∪ B means the union of sets A and B.
unit of measurement
A unit of measurement is a one unit of a quantity. For example, units of measurement for length include metres and centimetres.
universal set
The universal set has symbol ξ and contains all the elements being considered in the problem.
unknown
Unknown is another term for a variable; a letter in an expression or equation.
unitary method
Unitary method is a method to solve direct proportion problems. Divide to calculate the value of 1 unit. Multiply, if necessary, to find the value required.
vector
A vector is a way of describing movement. Vectors have both direction and magnitude (size).
Venn diagram
Venn diagrams use circular regions to show relationships between sets.
vertex [vertices]
A vertex is the point where two lines intersect, such as the corner of a shape or the point of an angle.
vertical line chart
Vertical line charts are used for qualitative (categorical) data. In a vertical line chart, the height of each line shows the frequency.
volume
The volume is a measure of the space inside a 3D shape. Typical units are cm³ and m³.
word-based problem
Word-based problems are problems described in words, rather than in mathematical terms. To solve word-based problems, you need to use the information to form equations.